
 Trump wins in deep blue DUBUQUE but not Scott County, the least blue of the large counties
- What’s up with that?
- Fortunately outperforming Republican counties more than made up for lesser performances in Blue and purple counties to create a “landslide” win in purple Iowa, a state that voted for the Democrat in 6 of the previous 7 presidential elections.
- Trump did not lose in Scott County because of Libertarians or anyone else.
In a November 21, 2016 communication by the Scott County Republican Chairwoman Judy Davidson, the following summation of the Scott County Republican general election performance, under her leadership, was included as part of a multi-purpose communication. The quoted material was part of a section titled “Thank You Once Again and interesting statistics for Scott County”. We are interested in statistics as well so we will offer some in perspective. Forgive us but we also detected a bit of scapegoating as regards the narrow win by Hillary Clinton in Scott County. We respond to that as well.
Although we did not carry President Elect Trump and Vice President Elect Pence in Scott County, the actual numbers for this race are significant. In 2016 in Scott County, the Trump/Pence ticket lost by about 1200 votes, but in 2012 and 2008 in Scott County, Romney and McCain each lost to Obama by OVER 12,000 votes, so we made a substantial difference in 2016. Or, put another way, Obama won here in 2012 by 14%, but Hillary only won here by 1.4 %.
Also interesting to note is that we had 1119 write in votes, 1957 votes for other candidates listed on the ballot and 3550 votes for Gary Johnson. There were a total of 6 counties in Iowa where Hillary won, all urban counties but Scott County had the closest race with a 1.4% difference, the other 5 counties had percentage differences ranging from7 %, 9%, 12% and 39%. The number of registered Independents is highest for us, then Democrats and lowest are Republican registrations. So, even though it was not an actual win for the Presidential ticket here in 2016, we did make great gains in Scott County. The demographics for us are highest , (sic) not bad for a county which has for registrations the and we look forward to a brighter future for America. (sic)
(We think we get the drift of the last sentence and Lord knows we have jumbled a sentence or two in haste to get out a communication)
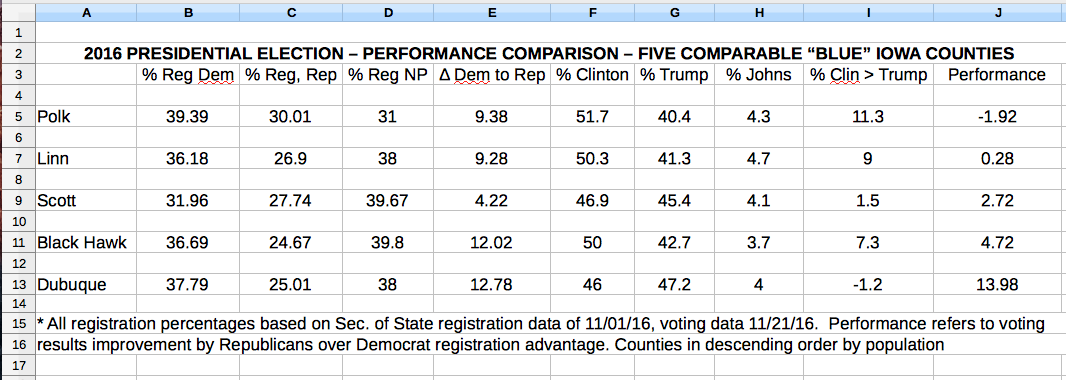
Below is a table setting forth our presidential election “performance” figures for Iowa’s five largest comparable “Blue” counties. Presumably the five “urban” ones referred to above. Blue referring of course to significant Democrat registration superiority over Republican “Red” registrations.
Comparable counties as referred to here involves the criterion of largest in size of the Blue counties in the state while also having a large manufacturing base as opposed to being an overwhelming, and typically liberal, “university” town. The latter criterion eliminated Johnson County, the deepest of blue at 48 % Democrat registration vs 21% Republican, because it is just not comparable culturally to the others. Iowa’s Woodbury County has a few thousand more in population than Dubuque but it is a Red county (or as Red as Scott County is Blue) and we are comparing Blue counties to each other in this inquiry.
Performance here is derived by using percentages and comparing the difference in party registration between Democrats and Republican in the county, and the difference in how the parties’ presidential candidates fared in the general election. If the positive difference in percentage points in the vote for the Republican presidential candidate over the Democrat is greater than the difference in registration for the two parties then the difference between those two figures is the positive performance figure for the election.
“No party” registrants are presumed to break in the same direction and portions as the Democrat and Republican registrations. “Third-party” influences were about the same for the counties studied, minimal by comparison. Nevertheless the percentage of the vote for Libertarian candidate Gary Johnson are shown and were within one per cent of one another at an average of about 4.1%. As to the impact of that vote, each county party apparat had approximately the same situation to deal with and therefore no significant comparative disadvantage.
Take Black Hawk County in the chart as an example. The gap between percentages of registered Democrats and Republicans is 12.02 percent which by our presumptions is also the amount which one might presume the Democrats’ main candidate would fair over the Republican candidate. However Clinton only beat Trump in that county by 7.3%. The difference in those two figures, registration advantage (col. E) less vote difference (col. I) is the amount (col. J) Republicans outperformed in that county — 4.72 in Black Hawk’s case. If the presidential electoral gap is more than the registration figure then Republicans under-performed. Republicans in Polk had a 9.38 % registration disadvantage but lost by 11.3 points, so they under-performed by 1.92 percent. It is reflected as a negative number.
Looking at the results reflected in the chart we see that Scott County was mediocre among large Blue counties and the champ was Dubuque, a traditionally Blue county with a large Democrat registration advantage that has not voted for the Republican presidential candidate in 60 years, and then for the grandly popular Dwight Eisenhower (Democrats only carried 7 states that election).
 In our investigation we also noticed that there were Red Republican counties that dramatically out performed what they would be expected to do using our criteria. A few quick examples are Benton County whose performance figure was +14.3; Carroll County, an almost purple county, had an astonishing +28.4 Republican performance; Cedar County had + 12.5; Clinton County had + 12.6; Des Moines County (Burlington) had + 8.5 and purplish Muscatine had a +5.7 for Trump.
We are working on a presidential performance table showing all counties in the state. Keep in mind that these figures use relative party strength as the predictor so no county’s performance is being inordinately represented. At a glance of registration advantages and vote results, it appears many if not most counties outperformed Scott County as to the 2016 presidential election.
But for this post the question is why did one Blue county or counties outperform another? More thoughts in coming posts, but we believe it boils down to how effectively the Republican message is exemplified and amplified in those counties.
County organizations are not entirely responsible for messaging when it comes to presidential politics, but they can enhance what resonates for the candidate by having an ear to the ground and having the confidence of potential activists and the enthusiasm to amplify the candidate’s message in consort.
Successful political messaging definitely means issue canvasing and effective targeting. It also entails defending the candidate’s adherence to key Republican principles and, something sorely missing in Scott County, — any effort at appropriately attacking the opposition and undermining their support in every venue available. Rock Island County Republican leadership has demonstrated effective messaging.* The extent such messaging is done is more important than rote, uninspiring “get out the vote” efforts and “vote early” hectoring campaigns that are wasteful, even counterproductive.
We accept that most messaging is out of a county party apparat’s control in the short-term. However, unless messaging and confidence building programs exist or are consistently attempted, in furtherance of a Republican movement, there isn’t much reason to claim credit for election performance or blame factors every other county had to contend with, such as third parties and write-in votes.
A frequent whipping boy of the Scott County Chairwomen is the Libertarian party or allied operatives. It is no different or fruitful or instructive to blame them than to blame conservative Democrats for not voting Republican. It is a useless tautology to blame other parties for their success, or your party’s election shortcomings.
Any statement or implication that but for the Libertarian candidate Trump would have won Scott County is scapegoating. It is true that Libertarian candidate Johnson garnered 3555 votes and Trump lost by 1291 votes (SOS figures) but it is just as true that the Scott County apparat failed to turn out 21 more votes for Trump per precinct from the average of 30% of the people who didn’t vote in the precincts (a pool of hundreds per precinct). Alternatively they (we) did not alter the thinking of 11 voting Democrats per precinct to vote for Trump or give 21 of them a compelling reason not to vote for Hillary.
It was relayed to us that Scott County personages also still have it in their mind, and use it as another example however faulty, that Libertarians, or their candidate, “cost” or caused the defeat of the 2008 Republican candidate for County Auditor. As we have responded to this charge before, the candidate, a former alderman, did not even carry his former ward. Hard to make a case of “stolen” popularity in such a circumstance. It makes as much sense, and is just as enlightening to blame Democrats for defeating Republicans. Incredibly, the scapegoating is by some of the same element that didn’t even field a candidate for Auditor in the just past election.
R Mall
*We would have included Rock Island County in our comparison but hard registration figures by party are not kept. According to Chairman Bill Bloom, “in Illinois, there is no registration by party process. During the primary, you ask for a ballot by party and that is what identifies you. If you ask for a Republican ballot you are considered a Republican. If you ask for a Democrat ballot, you are a Democrat.” That is considerably more fluid, psychologically and otherwise than the system in Iowa. Trump did very well in the county, we suspect better comparatively than Scott (‘registration” compared to actual vote) but because of different criterion as to party affiliation we did not include it in a direct comparison.
A leader always knows what to do, a deceiver always knows who to blame.